This blog was provided to WBA by IO by HFCL.
The assumption built into every campus network investment is wrong.
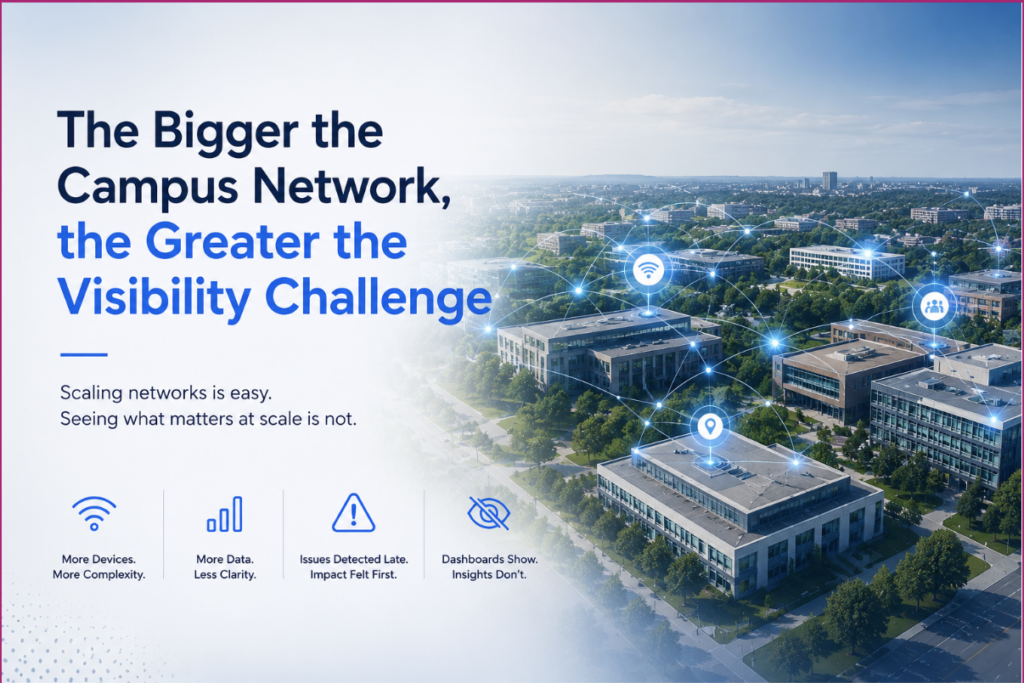
Most campus network investments are built around one assumption: as networks become more advanced, they also become easier to monitor and manage. More access points, larger switching infrastructure, centralised management platforms, and richer analytics should, in theory, give IT teams better visibility into what is happening across the campus network.
It sounds logical. But in practice, the opposite often happens.
As campus networks scale across thousands of users, devices, buildings, and applications, they become significantly harder to observe in real time. The network may generate more data than ever before, but extracting clear, actionable insight from that data becomes increasingly difficult.
At scale, networks become complex to configure and they become hard to observe. Every new access port, every new endpoint/user increases the complexity that teams have to deal with. While modern network management platforms are highly capable, operational visibility becomes significantly harder as campus environments scale across thousands of users, devices, access points, and switching layers. The challenge is often less about tool availability and more about extracting timely, actionable intelligence from the sheer volume of network telemetry being generated.
The result is network teams that look like they have visibility – dashboards, alerts, reports, but lack clear insight into what is happening. Problems are noticed only after users report them. The root cause may take days and weeks to trace back to when it first appeared. Infrastructure decisions end up being driven by past incidents rather than real network intelligence.
This is not a failure of effort. It reflects a gap in how the industry has approached network design. The focus has been almost entirely on building larger, more capable networks. Far less thought has gone into making those networks easier to understand and act on.
The visibility illusion
Walk into the network operations centre of most large campuses and the screens look impressive. Dozens of KPIs updating in real time. Colour-coded maps showing network status across every building. Alerts configured for every threshold breach. The infrastructure of visibility is present and accounted for.
But there is one question worth asking about every one of those screens. Is this showing you information that is relevant and actionable?
Most campus network monitoring tools are descriptive. They record and display the state of the network at a given moment. When something goes wrong, an access point degrades, a zone becomes overloaded, interference starts affecting a cluster of devices, the dashboard reflects that fact. Eventually. After the degradation has been happening long enough to register as a meaningful deviation from baseline.
By that point, users have already felt it. Complaints have already been filed. In an academic environment, the damage may already be done. An assessment disrupted. A lecture derailed. A research session lost.
That is not visibility. That is a delayed incident log with better graphic design.
Real visibility looks very different. It means identifying early signs of service degradation, rising latency, roaming instability, authentication delays, or capacity stress before users begin experiencing noticeable disruption. It means seeing that a zone is trending toward overload forty minutes before a lecture fills the room. It means understanding that recurring performance issues in one zone may be linked to upstream congestion, channel overlap, misconfigured policies, or network behaviour originating elsewhere in the campus environment. It means the network team is consistently one step ahead of problems rather than perpetually one step behind.
On a small network, the gap between descriptive monitoring and genuine visibility is manageable. When something goes wrong on a small/mid-size- Wi-Fi network, a skilled engineer can walk the space, review the logs, and find the problem within hours. On a campus network with hundreds of access points, thousands of concurrent devices, and traffic patterns that across temporal and spatial domains, that gap becomes a serious operational problem.
Why scale makes this worse, not better
There is a paradox at the core of large campus network operations. The data required to achieve real visibility already exists in abundance. A network serving 50,000 users generates an enormous volume of telemetry. Device associations, signal measurements, packet captures, data usage counters, error rates, roaming events, channel utilisation across every access point at every moment of the day.
The problem is not a shortage of data. The problem is that the volume of data generated at scale is inversely proportional to any team’s ability to make sense of it in real time. At 500 users, an anomaly in the data stands out. At 50,000 users, that same anomaly is buried in noise. The signal is there. Finding it requires either a level of manual analysis that no operational team has the bandwidth to perform continuously, or tooling specifically designed to operate at that scale. Most campus networks are running neither.
What fills the gap instead is instinct and incident reports. Experienced network engineers who know from years working on a specific campus where problems tend to appear. Helpdesk tickets that cluster around certain buildings or certain times of day. Patterns that get noticed eventually, by people, through accumulated experience rather than systematic intelligence.
This works until it does not. It works until a problem appears somewhere new. Until it manifests in a way that does not match the established pattern. Until it compounds quietly for months before anyone connects the dots. At that point, the cost of flying blind becomes very visible, very quickly.
What poor visibility actually costs
The cost of poor network visibility rarely appears on a single budget line. It is spread across helpdesk hours spent investigating complaints that took too long to trace. Across infrastructure decisions made on incomplete information. Across EdTech investments that underperformed because the network they depended on was never properly understood.
It shows up in exam day failures that were entirely predictable given the load patterns of the preceding weeks, but that nobody saw coming because nobody was analysing load patterns predictively. It shows up in access points that underperform for months because the monitoring layer flagged them as operational while missing the subtler signals that something was wrong. It shows up in upgrades that were specified based on incident history rather than actual traffic analysis, solving the problems everyone remembered while missing the ones quietly developing in the background.
None of these are dramatic, singular failures. They are the accumulated cost of operating a complex network without genuine visibility into it. And at campus scale, that cost compounds with every additional user, every additional device, and every additional building brought onto the network.
What real visibility at campus scale requires
The answer is not more dashboards. More dashboards displaying the same descriptive data at higher resolution does not change what that data can tell you or how quickly it can tell you.
Real visibility requires a fundamentally different approach to how network intelligence is collected, processed, and acted on.
It starts with moving from threshold-based alerting to anomaly-based detection. Threshold alerts tell you when a metric has crossed a line you defined in advance. Anomaly detection tells you when something is behaving differently from its own established baseline. That distinction matters because the most damaging problems on campus networks do not announce themselves with a single dramatic spike. They degrade gradually, in ways that no manually configured threshold would catch.
It requires correlating data across the entire network rather than reading each access point in isolation. The problem manifesting as complaints in one building is often caused by something happening in another. Finding that connection requires a monitoring layer that looks at the network as a system, not as a collection of individual components each reporting their own status independently.
Predictive capacity modelling matters as much as real-time monitoring. The question is not just how the network is performing right now. It is how it will perform when the next lecture fills the hall, when assessment season begins, when a campus event doubles footfall in a single zone. A network that is regularly caught off guard by predictable demand was never truly watching.
And all of this intelligence needs to be accessible to the people who actually need it. Not just senior network engineers with the expertise to interpret raw telemetry, but the operational teams managing day-to-day performance across a campus that may span hundreds of buildings and thousands of access points.
The foundation everything else depends on
Every campus network investment decision, hardware upgrades, Wi-Fi 7 rollouts, density planning, capacity expansion, rests on one implicit assumption. That the team making those decisions understands what is actually happening on the network they are investing in.
For most campuses operating at scale, that assumption does not hold.
Visibility is not a feature to be added once the core infrastructure is in place. It is the foundation that every other infrastructure decision depends on. Without it, even the best-specified network in the world is being operated on guesswork. At campus scale, guesswork is expensive.
The industry has spent years developing increasingly sophisticated tools for building campus networks. The next frontier is developing the same sophistication for understanding them.
The larger the network gets, the more that gap matters. And right now, almost nobody is talking about it.